 Photo from Usplash
As the Director of Community at Vantage, I originally wrote and published this post on the Vantage blog on June 23, 2023.
FinOps cost data is best when it’s self-service — you want individuals at your company to be empowered to access and analyze the cost data that’s provided by your centralized FinOps team.
FinOps Practitioners are often building cost dashboards (a collection of related Cost Reports in a dedicated folder) for different parts of the business. However, the cost dashboard needed by an engineer is different from the cost dashboard needed by the executive team. Engineers need application-specific, granular cost data. Whereas executive leadership needs high-level views with the ability to dive in and explore the data as needed. Finance needs something different as well, such as a split between COGS/R&D, and cost by department, and enough information to forecast spend.
Billing data is complex, so let’s look at each of these levels in more detail, starting with the most granular.
Cost data for Engineers
Data is the heart of an Engineer’s workflow. Most teams are likely already monitoring things like response times, uptime, error rates, and server loads. Cost information adds another datapoint that allows developers to build more efficient applications, and catch and diagnose issues earlier and faster.
A cost dashboard, featuring multiple cost reports designed to be viewed together,
Ideally, your infrastructure should be tagged in such a way that allows you to isolate all costs that are associated with both engineering teams as well as individual applications. Teams are likely responsible for multiple applications, so the most useful Cost Report for a developer is costs filtered by team and grouped by application.
Filtering costs by team means the group will only see costs relevant to them, and grouping by application means the costs will be split in a useful way.
But there are a few more tricks that can make this data even more useful.
With an understanding of what each of these applications are doing, you can highlight specific costs or services. For example:
- You may want to see the changing provider costs over time for a specific tag shared across each of them
- It could be interesting view the changing costs of tags within tag with multi-dimensional grouping
- Other applications might benefit from a detailed view of network or disk IO.
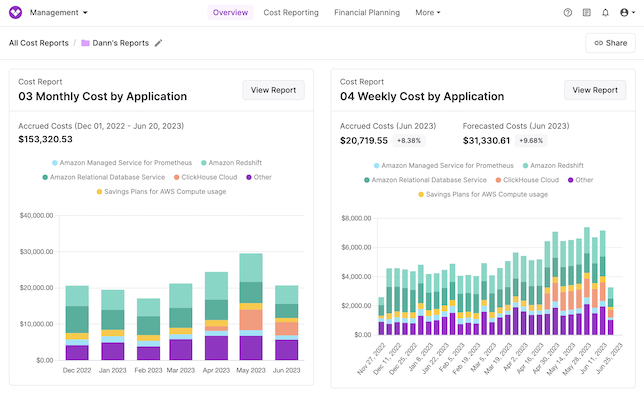 Photo from Vantage
Likewise, it can also be useful to see both data and context side-by-side. For me, this often means two versions of most graphs: a weekly cost view next to a monthly cost view. The weekly view is the core data, the monthly view provides a longer timeseries to contextualize any changes, and it’s easy to dive into a daily view for investigations as needed.
If you want to take your Cost Reports a step further, you can incorporate Unit Costs for each application, allowing you to track application efficiency at-a-glance and instantly tell if cost anomalies are justified or not.
Cost Data for Managers
At a level above engineers is management. Managers of a single individual team will most likely find the Cost Reports we previously designed to be most useful, but these Manager’s bosses (Director level) might be looking for something a bit different.
Directors typically have several different teams under them, and think more broadly about how multiple applications interact and fit together.
A similar approach could be taken as before, filtering by all the teams that a Director cares about, and grouping by application. Likewise, weekly and monthly costs, side-by-side, are useful for both current cost trends and associated context.
At the management level is where Segments is most useful, allowing you to allocate 100% of your costs to different business units using a bottoms-up methodology.
In my experience, the Management cost visibility layer is where it is most important to have a robust self-service program. Many Directors will want to build cost reporting dashboards completely by themselves, and these reports will be very unique to each individual Director and their needs.
Some of these views might be:
- How different teams’ costs change over time in relation to each other
- How much cost is going into R&D vs Operating Expenses
- The efficiency of different business units using Unit Costs
Cost Reports for Engineers are often the same base report for everyone — the only difference is the team that the costs are filtered on. Cost Reports for Managers often end up unique, so it’s important to either work closely with each Director when designing a Cost Report for them, or supporting their self-serving building of their own report.
Cost Data for Senior Leadership
The last group that benefits from cost visibility is senior leadership. From Vice President all the way up to the executive team (CEO, CTO, CFO, and others) need a different view of costs compared to engineers and managers.
Senior leadership is thinking less about day-to-day spend fluctuations, and more about the longterm strategy for the company and its different offerings.
Often, FinOps Practitioners are tasked with creating regular high-level cost reports for the consumption of senior leadership. In practice, the format of these reports can vary from company to company, but there are a few universal concepts shared at this Senior Leadership visibility level.
First, these cost reports should be mostly high level, but include the ability to drill down into the data as granularly as possible. Senior leadership needs to be able to understand the general direction of the business as a whole, and each of the different functions. The nitty-gritty details of what drives these changes need to be accessible, but hidden from the top-level view in order to avoid too much noise.
Second, these reports should be opinionated. Building a high-level report means that there will be several cost views that you’ll need to omit from the top-level report. There’s just too much information when you’re building cost reports that include costs for the entire company. When building senior-level cost reports, you should be opinionated about what is important to show, and what’s not important. And then collect feedback and adjust the report, until you have a fine-tuned repeatable product.
Third, these reports should highlight the top cost-drivers and initiatives across the company. Often, this means identifying projects that had an impact on spend (either positive or negative) and then partnering with the team responsible for those changes in order to document the details. Looping in engineers and managers to help you build out this report will supercharge the final product with higher granularly of data and context, while also ensuring that nothing about these cost events is long-in-translation.
Finally, be thinking in terms of repeatability when designing these reports. If you don’t yet have a regular practice of providing cost visibility to senior leadership, you may be surprised by the amount of positive feedback it gets. Building a cost report for Senior Leadership might start as a one-time project, but will likely become something that’s requested on a monthly or quarterly basis. You’ll save a lot of future time and effort if you keep track of all the queries and views that you use, and take notes about what you want to change for future reports.
Where to build these Cost Reports
There are multiple different ways to put together cost reports, and to make billing data self-service for engineers. These options range from very manual to way more automated. On the entirely manual end is making detailed billing data queryable via BigQuery, Athena, or Power BI. On the other end of the spectrum is a third-party cost visibility tool like Vantage.
When evaluating your options, there are a few things you should keep in mind:
- The number of cost sources (providers) you have
- How easy you want it to be to query the data and build reports
- If you want the data to be enriched with resource-level data
- How much of the process do you want automated
The more cost providers that your company is using, and the complexity of that billing data, the more value your company can get from a third-party tool. Building cost pipelines for each of these providers, and finding a way to normalize the costs can be a complex task. Additionally, small changes on the vendor side can break your workflow, forcing you to drop everything and fix the problem in order to restore cost visibility.
Additionally, it’s important for it to be easy to query the data, both for the centralized FinOps team, as well as for others using the data in a self-service fashion. A process like the one outlined in this article is build upon full cost dashboards, rather than individual queries. As well as the ability to view costs side-by-side.
Likewise, tools like Vantage enrich the detailed billing data with resource-level information, allowing you to see costs of individual instances, storage buckets, and more. And calculating efficiency using Unit Costs can provide valuable context to cost reports.
You’ll want most of these reports to be viewed on a regular basis. This means sending the dashboard to relevant stakeholders, or a Slack channel, on a regular basis. Additionally, having alerts for cost anomalies can help catch and prevent rogue spending.
It’s important to keep each individual stakeholder in mind when designing and implementing a cost visibility program. Your goal is to make the data self-service, empowering engineers to view the data that’s important to them, while also providing a solid foundation that show’s what possible.